What’s the best analysis technology for monitoring batch processes?
Mike Edwards
Features infrared monitoring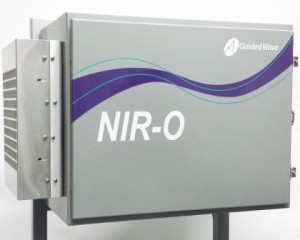
Spectroscopy is the study of how light and matter interacts. Light can be broken up into several regions of the electromagnetic spectrum, so spectroscopy is perfectly suited for accurate real-time analysis and monitoring of continuous and batch processes.
The near infrared (NIR), as well as the ultraviolet and visible (UV-VIS) regions of the spectrum provide a wealth of information about many chemical and physical properties to help operators control their processes better.
No other technology matches the acquisition speed and the range of measurements returned by a fibre optic-based spectrometer. A comprehensive set of data that takes hours of laboratory analyses to acquire can be available in less than a minute.
Spectroscopy Beginnings
Early spectrometers used prisms to separate the wavelengths of visible light. However, as scientists moved from studying visible and near-infrared light to the mid-infrared region, they discovered that prisms and the gratings of the early 1900s were slow, noisy, and lacked resolution. The solution for mid-infrared spectroscopy was the interferometer designs of Michelson.
Modern Spectroscopy
However, in the late 20th century the electronics, optics, and other components inside a spectrometer system improved.
Modern dispersive spectrometers use highly engineered gratings to separate the wavelengths of light and reduce stray light. A diffraction grating is essentially an aluminum-coated
mirror with thousands of parallel and equally spaced grooves etched into its surface. As such, a grating is one of the most precise objects ever made. How gratings work is described in all good freshman level college physics textbooks.
John Coates of Perkin-Elmer found that both Dispersive Analyzers (NIR and FT-NIR systems) have equivalent performance. (Coates, 1994 NIR news DOI:10.1255/nirn.250). If both analyzers have equivalent performance how do you decide which technology is the best choice for your analysis?
How to Select the Proper Technology?
 FT-NIR is a powerful technique, especially in a laboratory setting where samples can be introduced to the spectrometer without using optical fibre. FT’s also work well for measuring samples in reflection such as powders or solids. However, when considering NIR for a process application that involves a “clear” liquid or gas using optical fibres, Dispersive NIR instruments become the preferred choice both economically and technically.
The bandwidth of spectral features varies with the state of the sample. Gases and vapours have spectral features (lines) that are very narrow. Liquids and solids have very broad spectral features (bands) due to the hindered rotation of the molecule in its matrix.
For clear liquid hydrocarbon samples (the bulk of NIR applications), the bandwidths range from 2 nm to 12 nm. Aqueous samples are even broader. For condensed samples, the higher resolution of FT-NIR is neither required nor desirable since high resolution always comes at the cost of signal-to-noise ratio (SNR). The latter property for chemometric analysis of complex hydrocarbon mixtures is more important for accurate analysis than resolution.
A scanning grating dual-beam (DG-NIR) spectrometer actually produces a superior signal-to-noise ratio (i.e., better sensitivity for lower detection limits) and greater stability to withstand ambient fluctuations. In addition, the dual-beam operation provides the added benefit of superior long-term stability required of process analyzers that must operate unattended for weeks. Dual-beam operation is easy to implement in a grating instrument but difficult in an FT-NIR analyzer. Most FT-NIR analyzers do not operate in dual-beam mode hence they require more frequent referencing to compensate for photometric drift.
Additional Considerations and Comparisons
When comparing and choosing analyzer technologies there are other important factors to consider, such as, analyzer validation, ongoing maintenance costs, multi-channel operations and moving parts.
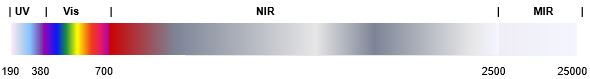
The electromagnetic spectrum between 190 nm to 25,000 nm
Conclusion: DG-NIR Advantage
When considering NIR for process applications that involve a “clear” liquid or gas, DG-NIR is the superior choice. By developing NIR analyzers with dual-beam, post-dispersive planar gratings, the engineers and scientists at Guided Wave have advanced the state-of-the-art in dispersive NIR technology. By incorporating these advancements without compromising the dual-beam operation, Guided Wave can offer to the market a DG-NIR analyzer with superior accuracy and resolution.
The DG-NIR advantage is a result of the precision-designed method of controlling light and all forms of aberrations. Guided Wave’s DG-NIR system has been carefully optimized to provide exceptional signal-to-noise ratio, excellent long-term photometric and wavelength stability, built-in multiplexing, and ease of maintenance.
This article was originally published in The Guide Post Newsletter, Fall 2018: Vol. 3. from Guided Wave.
CLICK HERE for the paper titled, NIR, Process Spectrometers: FT-NIR vs. Dispersive Dual-Beam (DG-NIR) Analyzers.
Print this page